Offerings From raw data to live dashboards: model once, share everywhere, and track what matters. Independent study (TEI). Results refer to a composite organization. Power BI Power Query, gateways, 1000+ sources, files, APIs. Relationships, DAX measures, calculation groups. Rich visuals, custom visuals, drill through, bookmarks. Live tiles, metrics scorecards, alerts. Workspaces, apps, Teams, SharePoint, Excel, mobile. Row-level security, sensitivity labels, endorsements. Data platform Large models, partitioned refresh, real-time DirectQuery. Reusable transformations for consistent models. Dev to Test to Prod with rule-based changes. Power BI Embedded for customer-facing apps. Analyze in Excel, chat, pin and approve in Teams. Tenant settings, lineage, usage metrics, audit. Tell us a bit about your workflow. We'll show the setup we recommend for your team.Microsoft Power BI
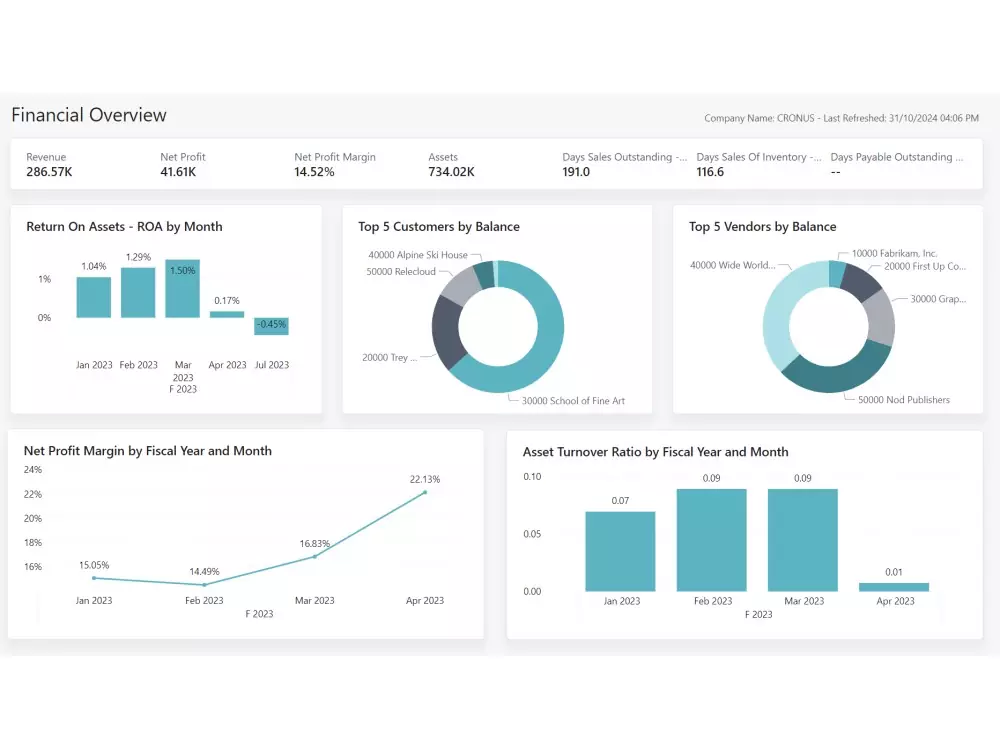
See the business impact with Power BI
Core analytics areas
Data connections
Data modeling
Reports & visuals
Dashboards & KPIs
Sharing & mobile
Governance & RLS
Capabilities that matter
Incremental refresh
Dataflows
Deployment pipelines
Embedded analytics
Excel & Teams
Admin & monitoring
Get in touch